top of page
Stephanie C. Swearngin
Design Leader, Digital Strategist, & Product Thinker
Data Visualization
Data-driven visuals that transform complex information into clear, accessible stories.

Project description
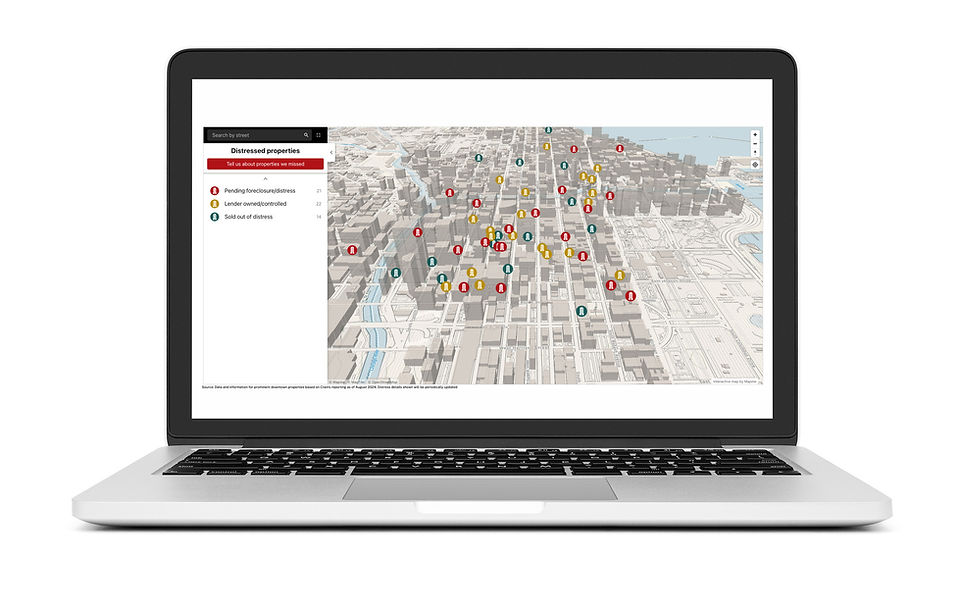
An immersive 3D data visualization mapping distressed commercial properties in downtown Chicago, published on the Crain’s Chicago Business website to help readers explore the scale of the market downturn.
My role
Senior Digital Designer
Process
Worked closely with the commercial real estate reporter to develop a visual concept that transformed complex property data into an interactive experience, offering readers a more engaging alternative to a traditional article format.
Recognition
Best Government, Legislative, and Regulatory Coverage, Neal Awards for Excellence in Business Media (2025).
bottom of page